WMO STATEMENT ON THE STATUS OF THE GLOBAL CLIMATE IN 2002: WMO STATEMENT ON THE STATUS OF THE GLOBAL CLIMATE IN 2002:RETURN TO EL NIÑO CONDITIONS GLOBAL SURFACE TEMPERATURES SECOND WARMEST ON RECORD,
GENEVA, 17 December (WMO) - The global mean surface temperature for 2002 is expected to be approximately 0.50 °C above the 1961-90 annual mean value, according to records maintained by Members of the ...

GENEVA, 17 December (WMO) - The global mean surface temperature for 2002 is expected to be approximately 0.50 °C above the 1961-90 annual mean value, according to records maintained by Members of the World Meteorological Organization (WMO). Consequently, 2002 will supplant last year (2001) as the second warmest in the instrumental record.
La temperatura media global de la superficie para el 2002 se espera que sea 0.5 ºC más alta que el valor medio del periodo 1961-90, de acuerdo con los registros de los países miembros de la OMM. Como consecuencia, el año 2002 será el segundo año más cálido, sustituyendo al 2001 de esta posición, desde que se tienen registros instrumentales.
The warmest year in the 1860 to present record for land and sea surface areas remains 1998. The ten warmest years have all occurred since 1987, nine since 1990. While the trend toward warmer globally averaged surface temperatures has been uneven over the course of the last century, the trend for the period since 1976 is roughly three times that for the past 100 years as a whole (see Figure 1). The rise in global average surface temperatures since 1900 now exceeds 0.6° C.
El Niño conditions returned to the tropical Pacific over the course of 2002. The potential for transitioning from more neutral to El Niño conditions was evident by the end of 2001. By midyear 2002, characteristic El Niño sea surface temperature and then sea level pressure patterns became well established. In the latter half of 2002, climate anomalies in many regions were broadly consistent with a maturing El Niño episode of moderate intensity.
Warm (positive) sea surface temperature anomalies in the tropical Pacific and indeed across much of the land and sea surface of the globe in general contributed to the near record temperature ranking for the year.
REGIONAL TEMPERATURE AND PRECIPITATION PATTERNS
Though the magnitude of the present El Niño episode is smaller than the 1997-98 event, the transition from neutral to El Niño conditions was nevertheless accompanied by a coincident transition in climate anomalies across some regions of the world. This was especially true across regions of the western Pacific. In the Southwest Pacific, nations in the more northerly latitudes of the region (closer to the equator) transitioned from drier than normal conditions before May 2002 to wetter than normal conditions after the onset of El Niño. In September, some stations in the Republic of Kiribati received rainfall in excess of 10 times the average value. Indonesia, Papua New Guinea, New Caledonia, Tonga, Niue and the southern Cook Islands, however, recorded well below average precipitation in some or all of the months following May 2002. The north of the South Island of New Zealand was drier than normal, while the west and south was wetter than normal. In Australia, near normal rainfall and cooler than normal temperatures observed in January and February 2002 gave way to warm and dry conditions beginning in March.
Widespread drier and warmer than normal conditions persisted thereafter. The pattern of dry conditions in the southern and western Southwest Pacific and wet conditions in the northern Southwest Pacific is typical of the region during El Niño episodes.
Widespread warmer than normal conditions for the year as a whole occurred across most of Asia, especially in Mongolia and regions immediately to the north (see Figure 2). Annual precipitation totals were above normal from central Asia eastward to northern China and the Korean Peninsula.
Monthly mean temperatures in East Africa Region were generally higher than average for much of the year. In southern Tanzania, heavy rains were reported in January and widespread near normal to wet conditions were found across much of the country through February and March 2002. Wet conditions were also observed in much of western and central Kenya and parts of Uganda in March and May where some locations recorded the wettest or near wettest conditions since 1961. Heavy rain also occurred during October and November in Uganda. The regions of central and southern Ethiopia, however, experienced a general failure of the rains in period from June to September.
After a mild 2001-02 winter in many areas, especially in the Great Lakes region, Canada recorded its fifth coldest spring overall. In parts of western Canada, spring was the coldest on record. Moisture deficits present at the end of 2001 in much of western regions of Canada and the United States were exacerbated by less than normal precipitation during winter and spring 2002.
In Sweden, the average temperature in all months of the year through September 2002 was above normal and the warmest summer ever in the period 1860 to the present was reported.
Heavy precipitation occurred in parts of the northeast region of Spain during the Northern Hemisphere summer and autumn. Persistent high temperatures were observed in June in Switzerland.
Abnormally high temperatures were observed during April across India and a prolonged heatwave over northern regions from mid-April through the third week of May caused hundreds of ,fatalities. On 10 May the maximum temperature at Gannavaram reached 49°C.
TYPHOONS, HURRICANES AND FLOODS
During the first two weeks of August, exceptionally heavy rains in parts of central Europe (including Germany, the Czech Republic, Austria, Romania, Slovakia) caused flooding of historic proportions, notably on the Elbe and Danube rivers. More than 100 deaths were reported with more than 450 000 forced to evacuate. Damage was estimated at US$ 9 billion in Germany alone. A number of rainfall records were set and the flood exceeded all historic levels in some places. In southern France, severe flooding led to 24 deaths and induced damage estimated near US $1 billion in September. The greatest precipitation total in the region was nearly 690 mm, which fell in roughly a 24 hour period.
In East Africa, flooding was observed in southern Tanzania in January and in Kenya and Uganda from March to May 2002. Flooding was also reported in Uganda during October and November 2002. The flooding episodes resulted in a number of impacts including land slides and loss of life.
During the Atlantic hurricane season (June – November) only four tropical storm systems developed to hurricane strength. Nevertheless, twice the normal number of storm systems (eight) affected the United States, including Hurricane Lili, the first land-falling hurricane to strike there since the 1999 hurricane season. September 2002 was also the most active tropical storm month on record in the Atlantic Basin.
In October, Hurricane Kenna made landfall near San Blas, Mexico. The storm was the third strongest in terms of wind intensity to strike Mexico from the Pacific and resulted in three deaths, thousands of homeless and tens of millions of dollars (US) in damage.
Typhoon Rusa made landfall on the Korean Peninsula at the end of August resulting in flooding and more than 240 dead or missing. The one-day rainfall total of approximately 870 mm set a national rainfall record for records that date from 1911.
The Asian summer monsoon and several typhoons brought heavy rains to the region from southern China to the Indochina peninsula. Flooding along the Changjiang and Mekong rivers resulted in several hundreds of deaths. The monsoon in eastern India, Nepal and Bangladesh was also active, leading to severe flooding in parts of the region and about 1000 fatalities.
At the end of October, a powerful wind storm caused damage across northern Europe, from southern England to the Baltic regions. Wind speeds over 140 km/hour were reported at numerous locations.
DROUGHT PRESENT IN MANY REGIONS
The seasonal rainfall during the summer (southwest) monsoon (June-September) in India as a whole was 19% below normal, qualifying 2002 as the first all-India drought since 1987. Rainfall deficits during July were most noteworthy, at a historical low of 49% below normal. Remarkable recovery in rainfall occurred in August and prevented the situation from worsening. In November, during the northeast monsoon season, good rainfall amounts were widely reported.
In Afghanistan, spring rains brought some relief to the four-year drought.
Across West Africa, precipitation was below normal in the Sahel and the Guinea Coast region throughout much of their wet season. In the Sahel, countries in the far west, especially Mauritania, Senegal, and Gambia, accumulated the greatest rainfall deficits, with some locations receiving only 25% to 50% of their normal rainfall by the end of September. In the Greater Horn of Africa region, drought conditions that date to mid-1998 continued unabated in parts of the region, especially in central and southern Ethiopia.
For the second Northern Hemisphere summer in a row, dry conditions were experienced across much of Central America and parts of Mexico. As in the case of the severe drought last summer (2001), the countries most affected this year were Honduras, Nicaragua, El Salvador, and Guatemala where significant agricultural impacts were reported.
In the eight months from March to October 2002 approximately 70% of the Australian continent received rainfall totals in the lowest 10% of all March to October periods since 1900. Nearly all remaining areas of Australia experienced drier than average conditions. Dry conditions were accompanied by higher than average maximum temperatures. The Australia-wide average maximum temperature during the Southern Hemisphere autumn, winter and spring of 2002 was the highest since high quality temperature records commenced in 1950.
In Canada, drought particularly affected central and northern areas of the Prairie Provinces, somewhat north of the region most impacted in 2001. In the United States, drought conditions worsened in the west, but some improvement was seen in the east. Persistent dry conditions in the western United States contributed to the second worst wildfire season in history.
ANTARCTIC OZONE HOLE
During 2002, the Antarctic ozone hole was the smallest since 1988. In late September an unprecedented event occurred when the ozone hole split into two. The two holes were relatively small and each contained a core depleted of more than 50% of its ozone. The ozone hole briefly intensified until mid-October, but then disappeared in early November. Not only was the 2002 ozone hole the smallest since 1988, it was also the shallowest and the shortest lived. The size, depth and persistence of the ozone hole varies from year to year owing to natural changes in the meteorological conditions in the stratosphere.
ARCTIC SEA ICE
The extent of the sea ice cover in the Arctic Ocean in September 2002 was lower than in any previous September in the satellite observation period, which dates to 1978. Throughout this period of record, there has been a general downward trend in the Northern Hemisphere summer minimum arctic sea ice extent, but there is also considerable variability in minimum extent from year to year. The total area of surface melt on the Greenland Ice Sheet during 2002 also was reported to be greater than in other known records.
Information Sources
This preliminary information for 2002 is based on observations up to the end of November from a network of land-based weather stations, ships and buoys. The data are collected and disseminated on a continuing basis by the National Meteorological and Hydrological Services of the WMO Member countries.
It should be noted that following established practice, WMO’s global temperature analyses are based on data sets maintained by the Hadley Centre of the Met Office, UK, and the Climatic Research Unit, East Anglia University, UK as well as another authoritative global surface temperature data set, which is maintained by the USA Department of Commerce’s National Oceanic and Atmospheric Administration (NOAA). Results from these two data sets are comparable; both project that 2002 will be the second warmest year globally.
More extensive, updated information will be made available in the annual WMO Statement on the Status of the Global Climate in 2002, to be published in late March 2003.
(*A joint Press Release issued in collaboration with the Hadley Centre of the Met Office, UK, the Climatic Research Unit at the University of East Anglia, UK, and in the USA: NOAA's National Environmental Satellite and Data Information Service and NOAA's National Weather Service, and the International Research Institute in New York. Other contributors were WMO Member countries Australia, Canada, China, France, Germany, India, Japan, New Zealand, Spain, Sweden, Switzerland as well as the Drought Monitoring Centre in Kenya).
For more information please contact:
Ms Carine Richard-Van Maele
Chief, Information and Public Affairs
World Meteorological Organization
7 bis, avenue de la Paix,
CH-1211 Genève 2
Switzerland
Tel: (41 22) 730 83 14/5
Fax: (41 22) 730 80 27
E-mail: [email protected]
Internet website: http://www.wmo.ch
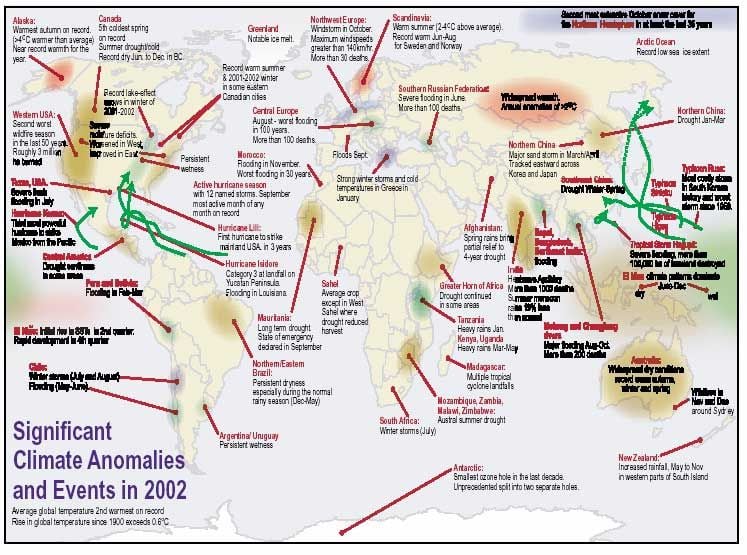
Añadido por la RAM según figura anterior. Algunos elementos significativos durante el año 2002:
Central Europe
August - worst flooding in 100 years. More than 100 deaths.
Mauritania
Long term drought.. State of emergency declared in September
Alaska:
Warmest autumn on record (>4oC warmer than average). Near record warmth for the year.
Average global temperature 2nd warmest on record
Antarctic:
Smallest ozone hole in the last decade. Unprecedented split into two separate holes.
Canada
5th coldest spring on record. Summer drought/cold. Record dry Jun. to Dec. in BC.
Argentina/ Uruguay
Persistent wetness
Mozambique, Zambia, Malawi, Zimbabwe:
Austral summer drought
Greater Horn of Africa
Drought continued in some areas
Afghanistan: Afg
Spring rains bring partial relief to 4-year drought
Northern China:
Drought Jan-Mar
Scandinavia:
Warm summer (2-4oC above average). Record warm Jun-Aug for Sweden and Norway N
Northwest Europe:
Windstorm in October. Maximum windspeeds speed greater than 140km/hr.
More than 30 deaths.
Hurricane Lili:
First hurricane to strike mainland USA. in 3 years
Hurricane Isidore
Category 3 at landfall on Yucatan Peninsula. Flooding in Louisiana. Flo
New Zealand:
Increased rainfall, May to Nov in western parts of South Island
Sahel
Average crop except in West Sahel where drought reduced harvest
Northern/Eastern
Brazil:
Persistent dryness especially during the normal rainy season (Dec-May)
Active hurricane season
with 12 named storms. September most active month of any month on record
g ) Persistent wetness
Western USA:
Second worst wildfire season in the last 50 years Roughly 3 million
South Africa:
Winter storms (July)
Madagascar:
Multiple tropical cyclone landfalls
Tanzania
Heavy rains Jan.
Kenya, Uganda
Heavy rains Mar-May.
Southern Russian Federation:
Severe flooding in June. More than 100 deaths.
Southe st Chin Morocco:
Flooding in November. Worst flooding in 30 years.
Greenland
Notable ice melt.
Arctic Ocean
Record low sea ice extent

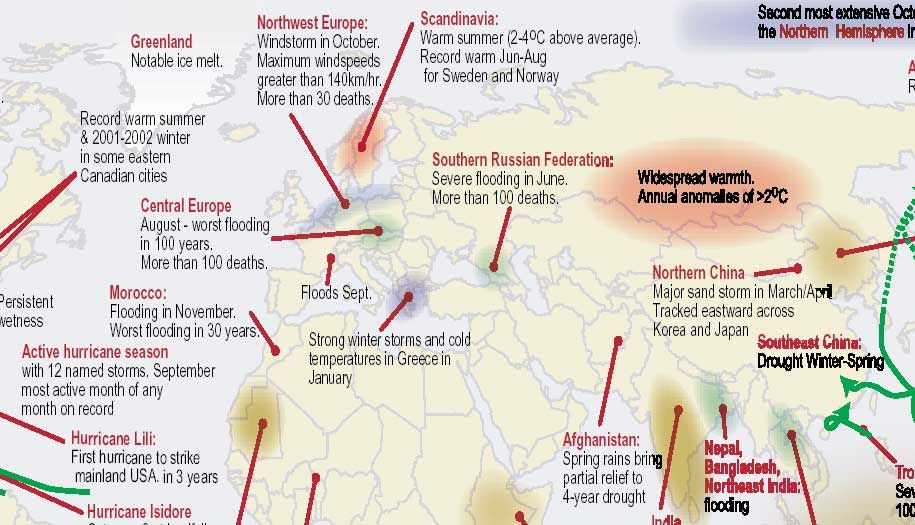
Idem que antes pero solo para Europa y Asía

Fuente. OMM
http://www.wmo.ch/index-en.html
Nota de prensa en formato pdf:
http://www.wmo.ch/web/Press/Press684.pdf (ocupa más de 2 Mb)


